The product
NFSea.tools was a startup building a live monitoring tool for NFT traders. It showed which collections were trending, what was minting right now, which drops were coming up, and how a collection's floor price, average price and volume moved over time. Paying members got more charts and data.
I built the frontend. The backend, the blockchain data and the GraphQL API were another team's. The startup closed, so the tool is no longer running. The screenshots here run my frontend against mocked API responses. The collection page shows Azuki, the collection the page was built around; the tables are filled with sample collections and prices.
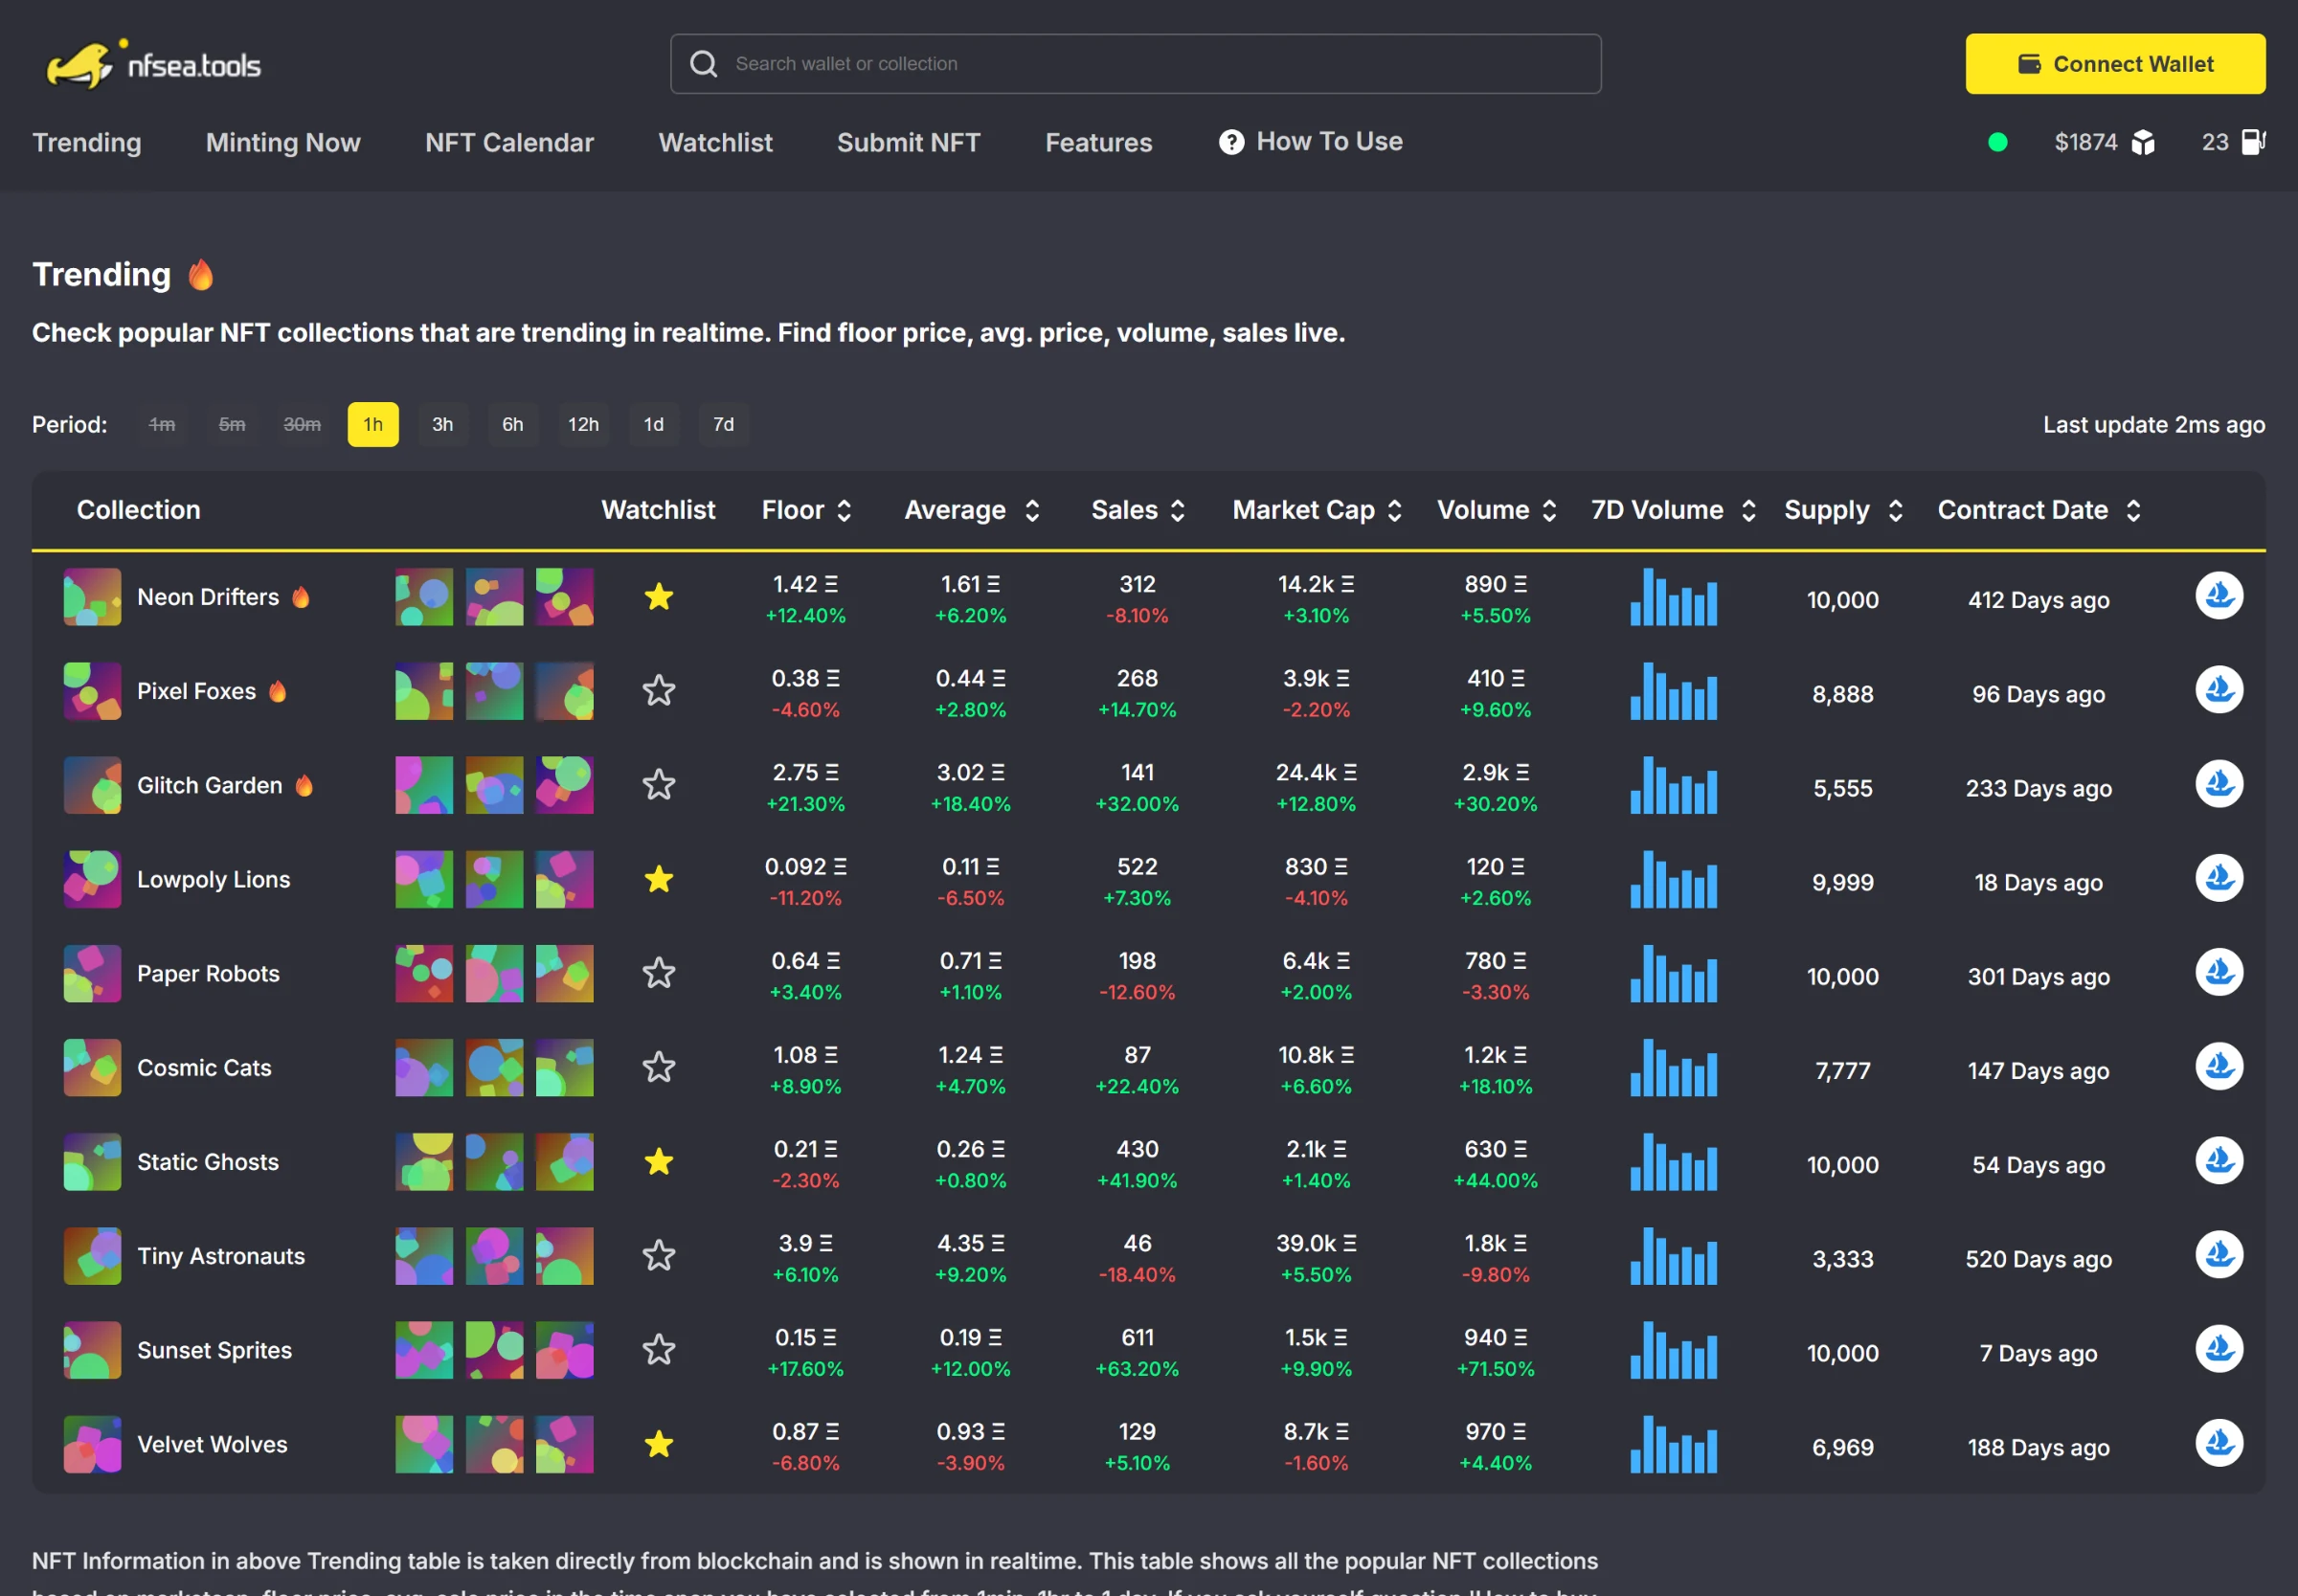
Trending collections, with the change against the previous period under every number.
What I built
21 pages in Next.js: trending, minting now, an NFT calendar, collection pages, a watchlist, a profile, a submit form, the features page and an admin area
The Apollo Client layer for 14 queries and 9 mutations against the team's GraphQL API
Wallet sign-in with MetaMask through ethers.js, and membership payments sent as an on-chain transaction, with a pending state while it confirms
A live ETH price over a WebSocket and the current gas price in the header, so they are always on screen
Price, volume and sales charts with Recharts, including a scatter of individual sales with an outliers switch
A discount page that checks whether a wallet holds an NFT from a partner collection
Embeddable widgets, so a collection could show its NFSea stats on its own site
An admin area to review and edit submitted drops and set them live on the calendar
A Docker build deployed through AWS CodeBuild
Tables that read at a glance
Every table puts the collection, a few sample pieces and the numbers on one row, with the change against the previous period in green or red under each value. A period switch changes the window from minutes to a week.
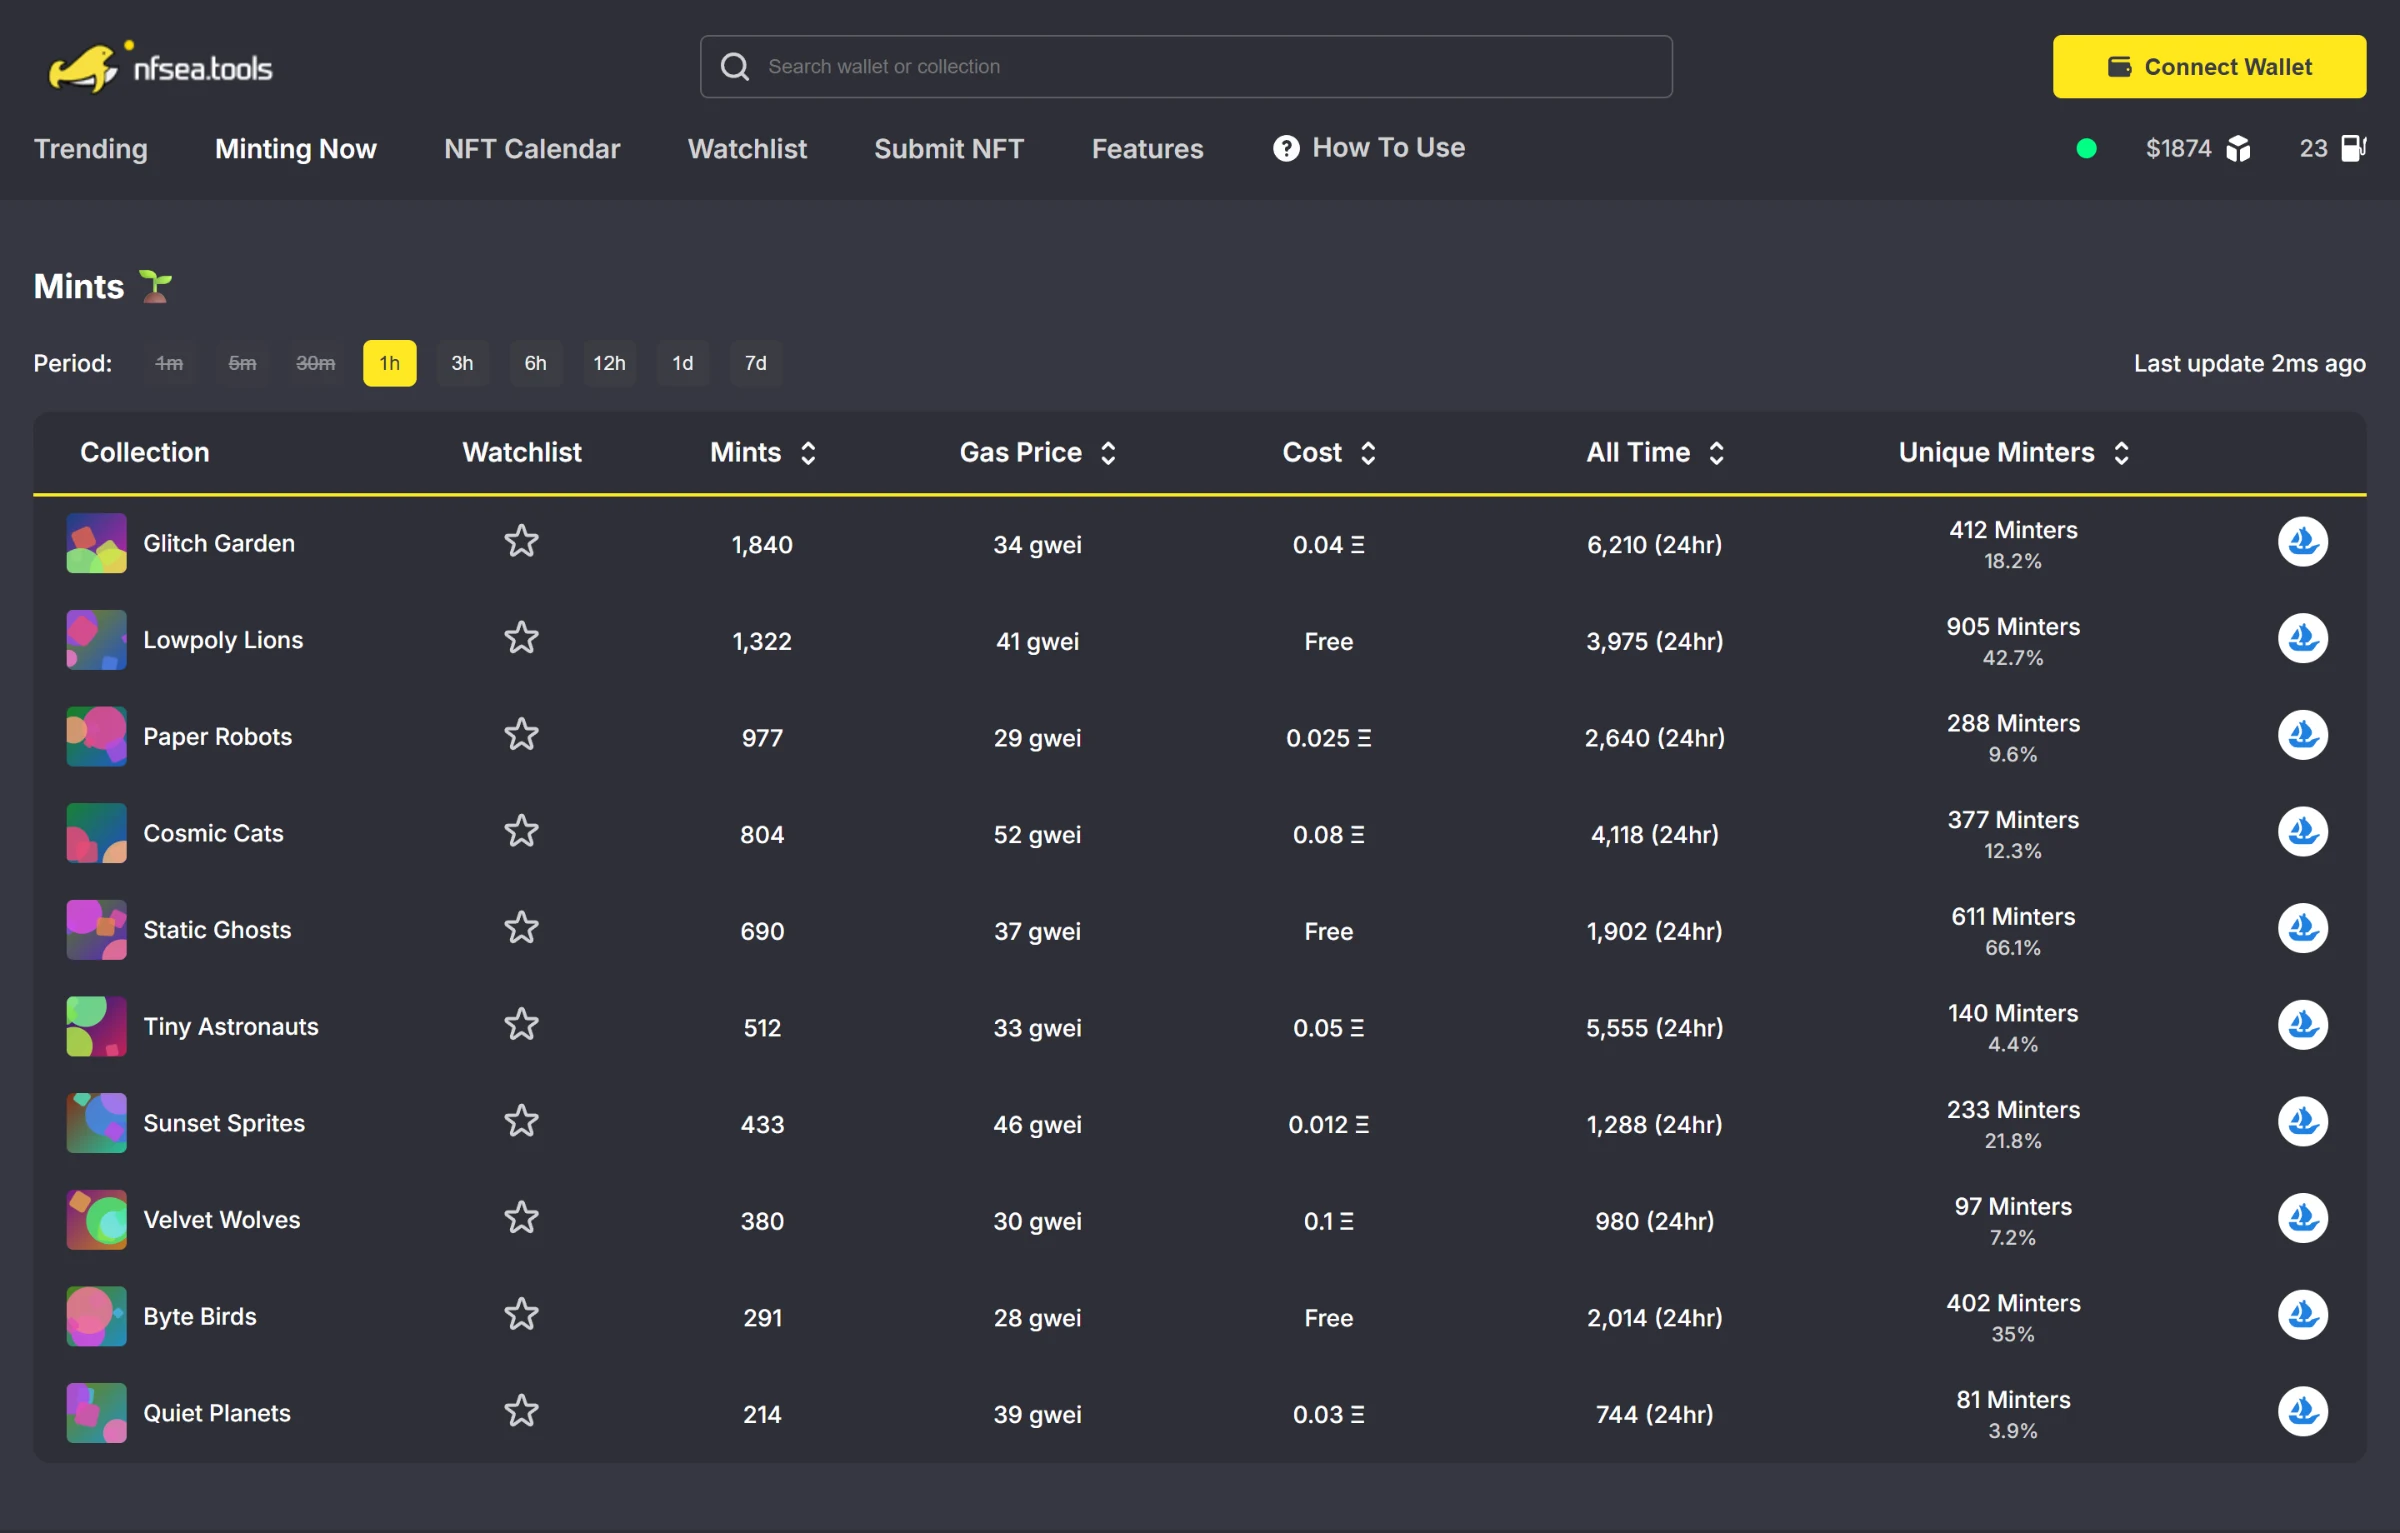
Minting now: what is being minted, at what gas price and by how many wallets.
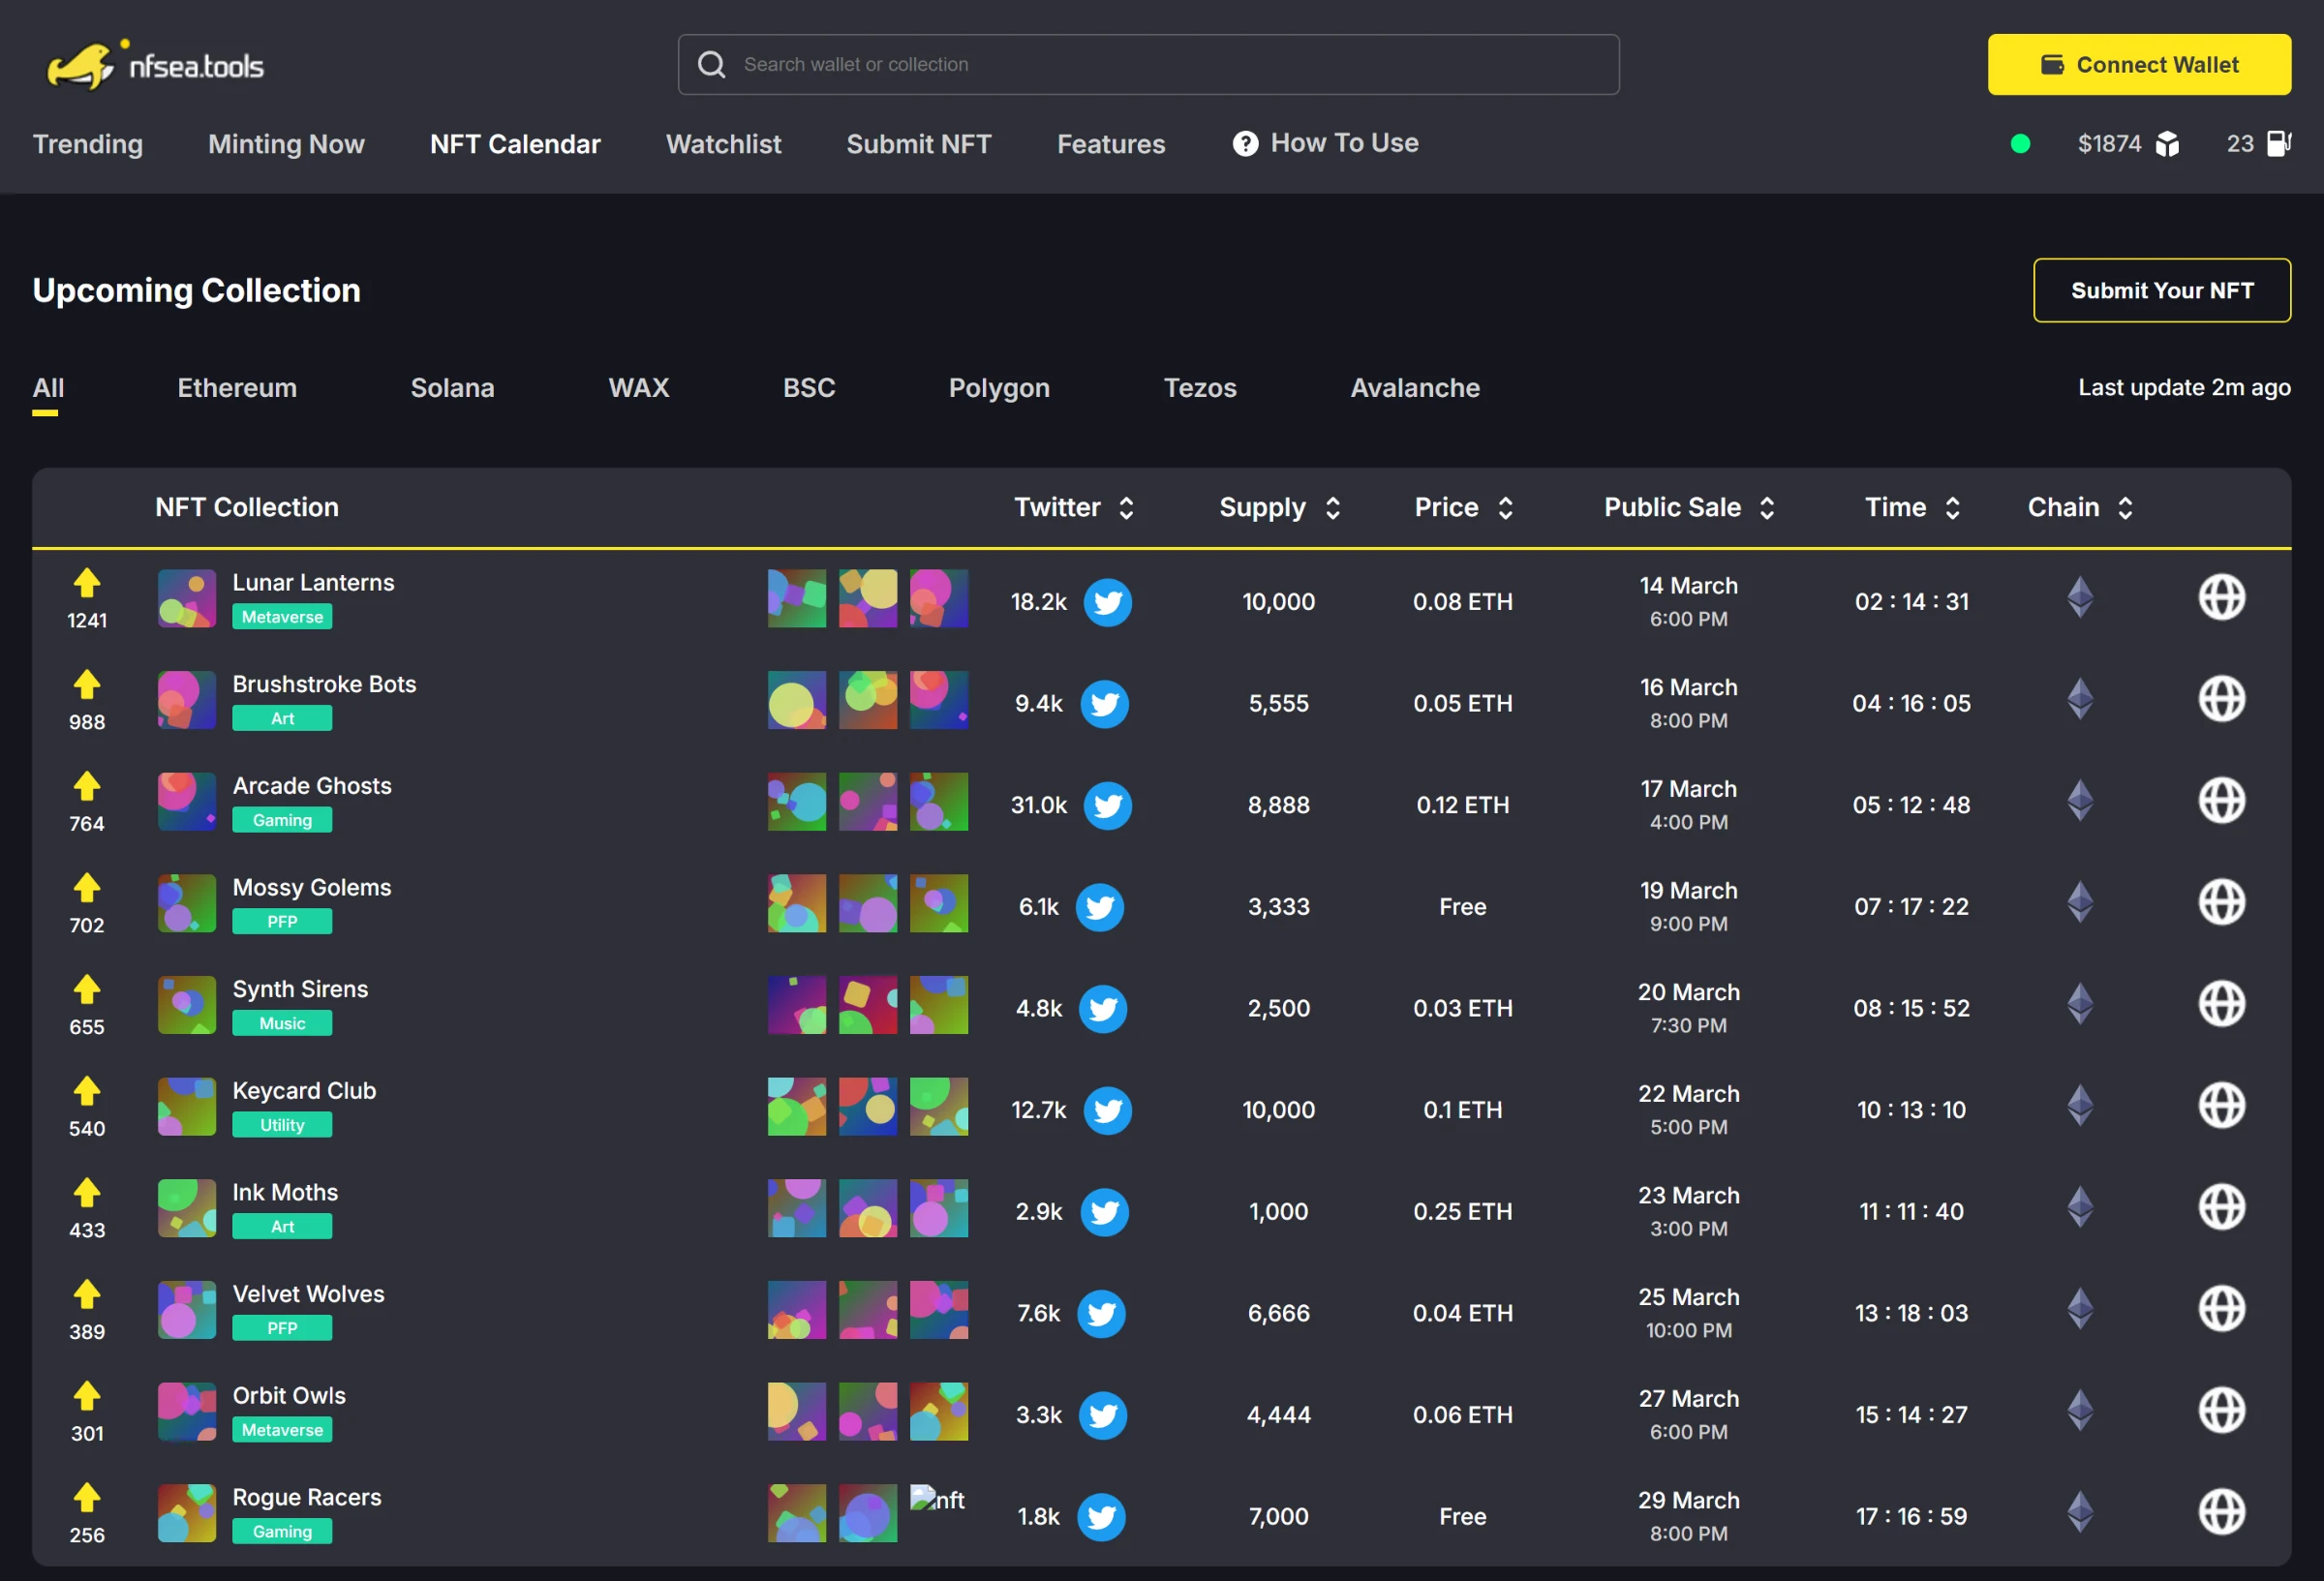
The NFT calendar: upcoming drops by chain, with community votes and a countdown to the public sale.
A page per collection
Each collection gets a page with its contract, supply, royalties and links, the price and volume figures, and charts over time. Free users see the main charts; the rest sit behind a blurred preview with a subscribe button, which is how the product sold membership.
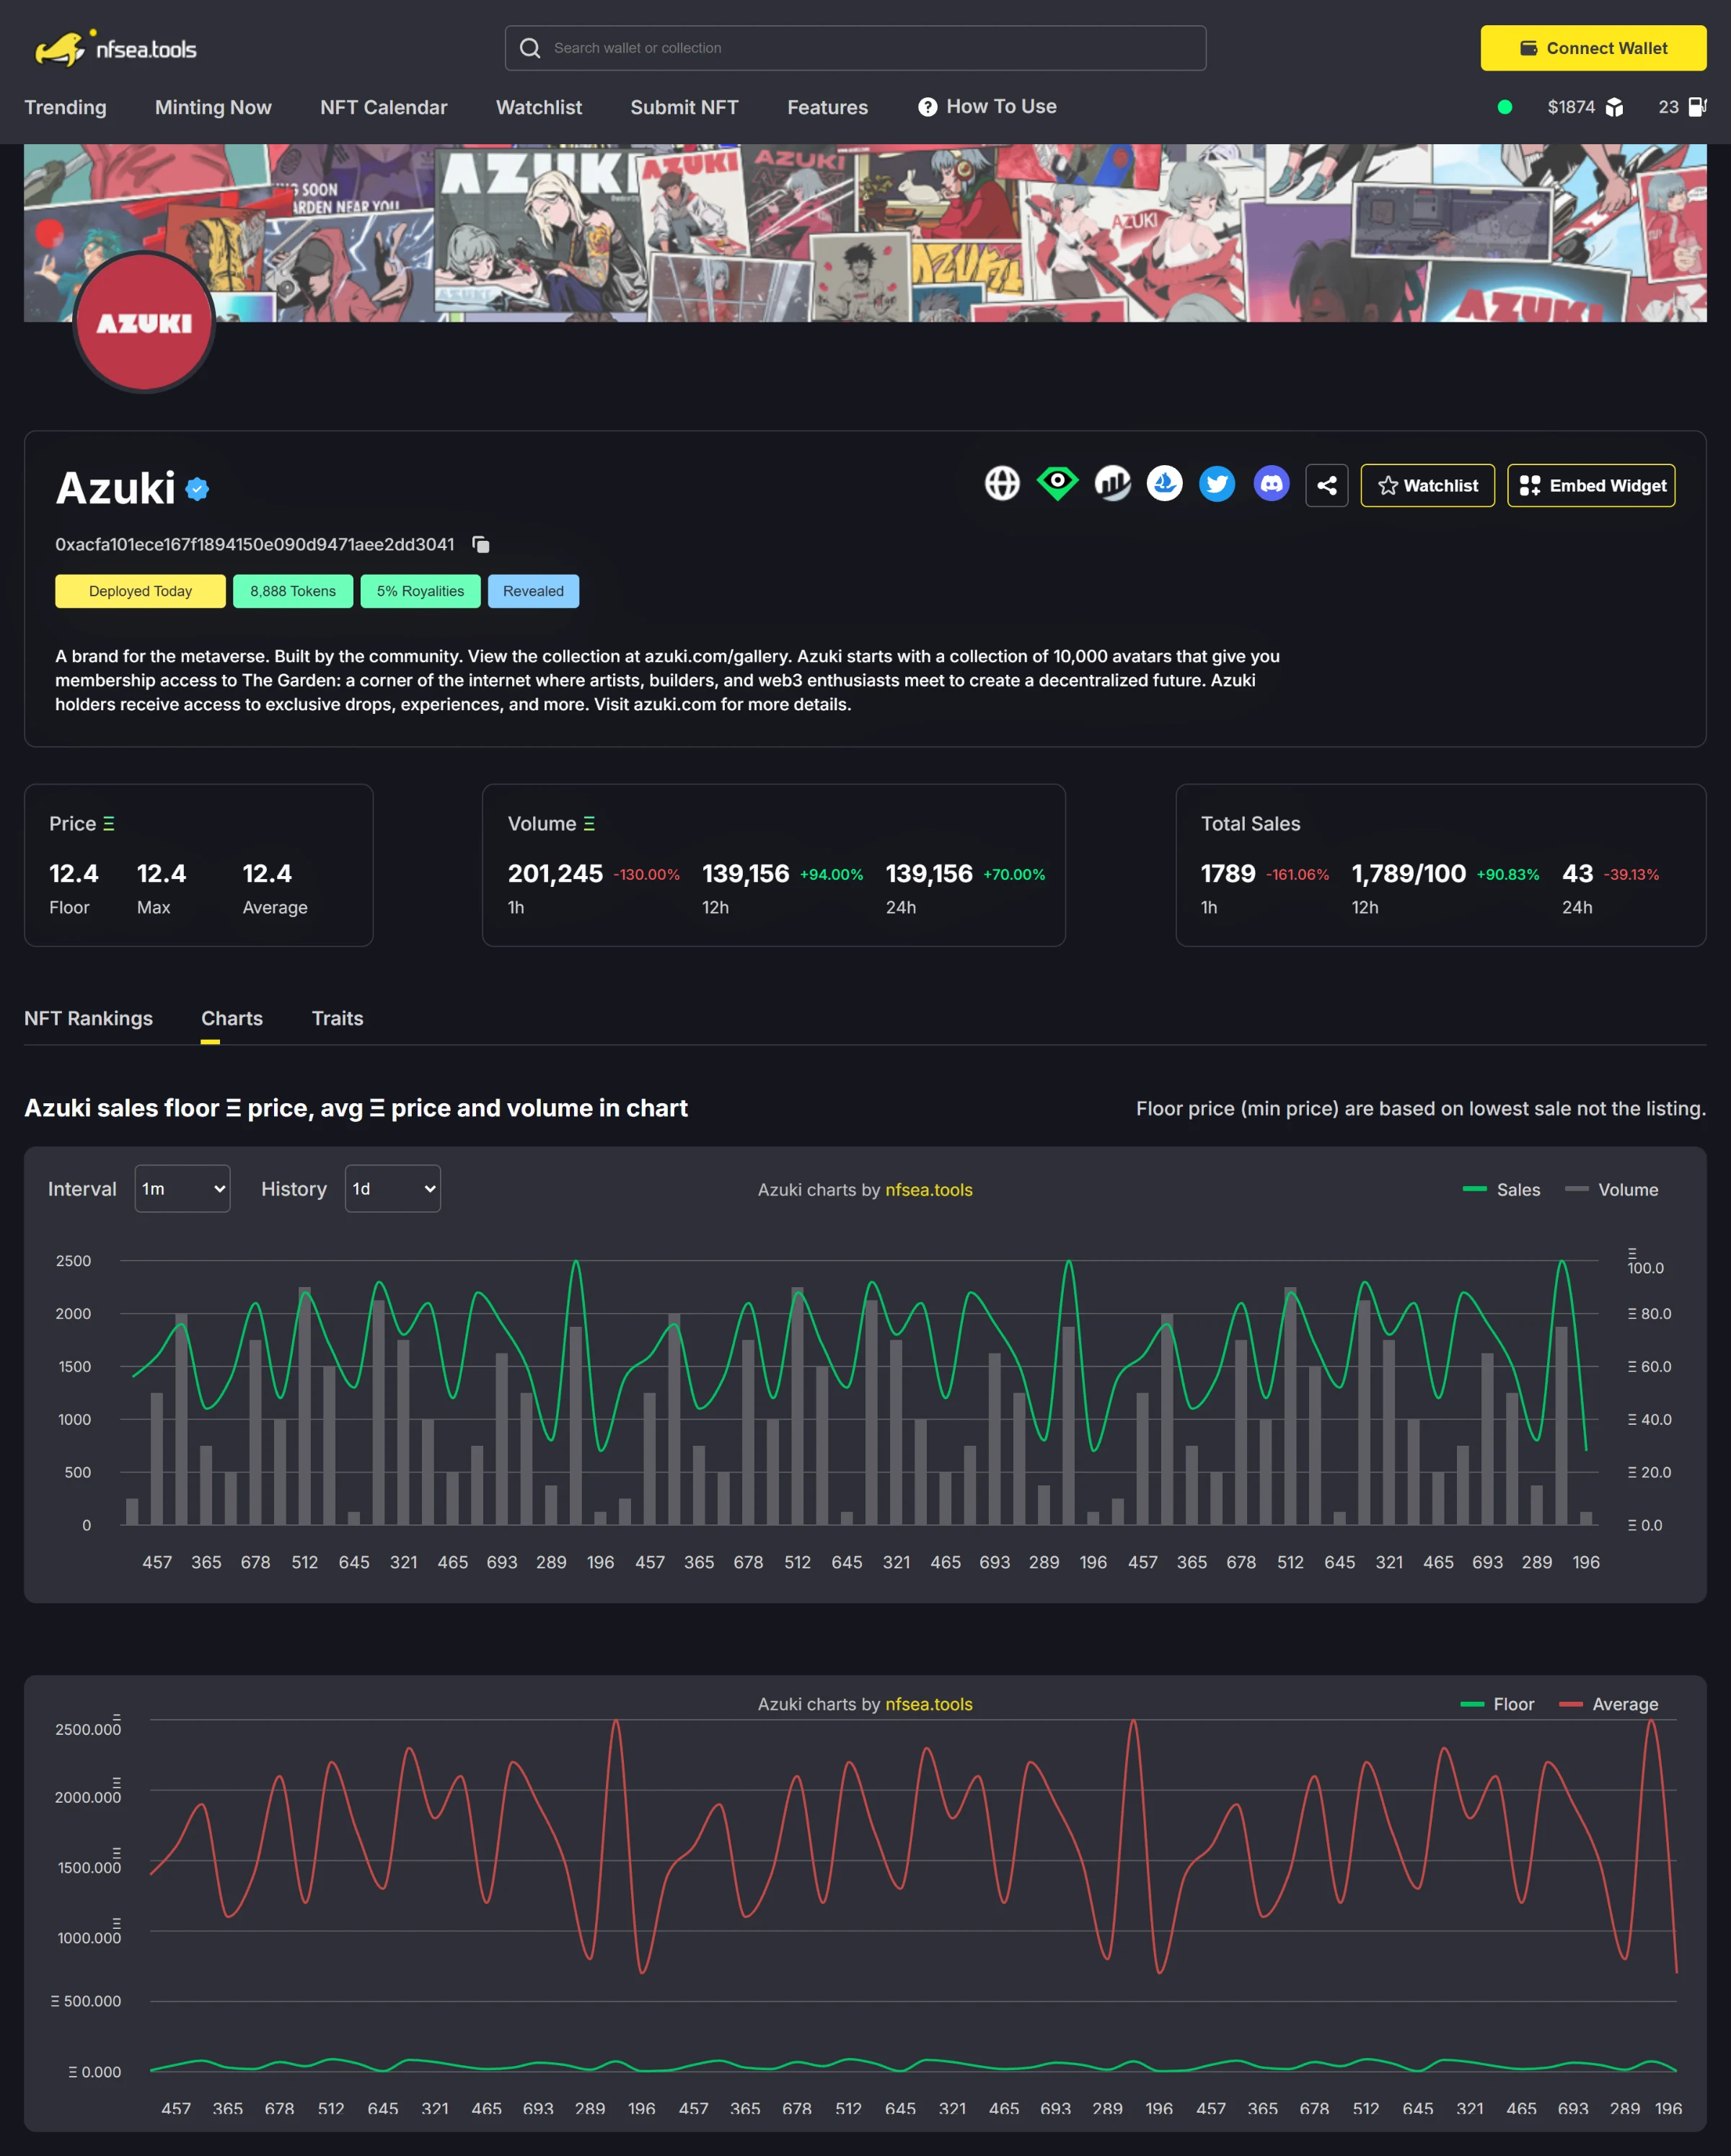
The Azuki collection page: stats on top, then sales, floor and average price charts.
Selling the tool
The features page explains the product in one scroll: a live table, the list of features with what was coming soon, and a call to connect a wallet. Connecting opens the wallet modal, which signs the user in with MetaMask.
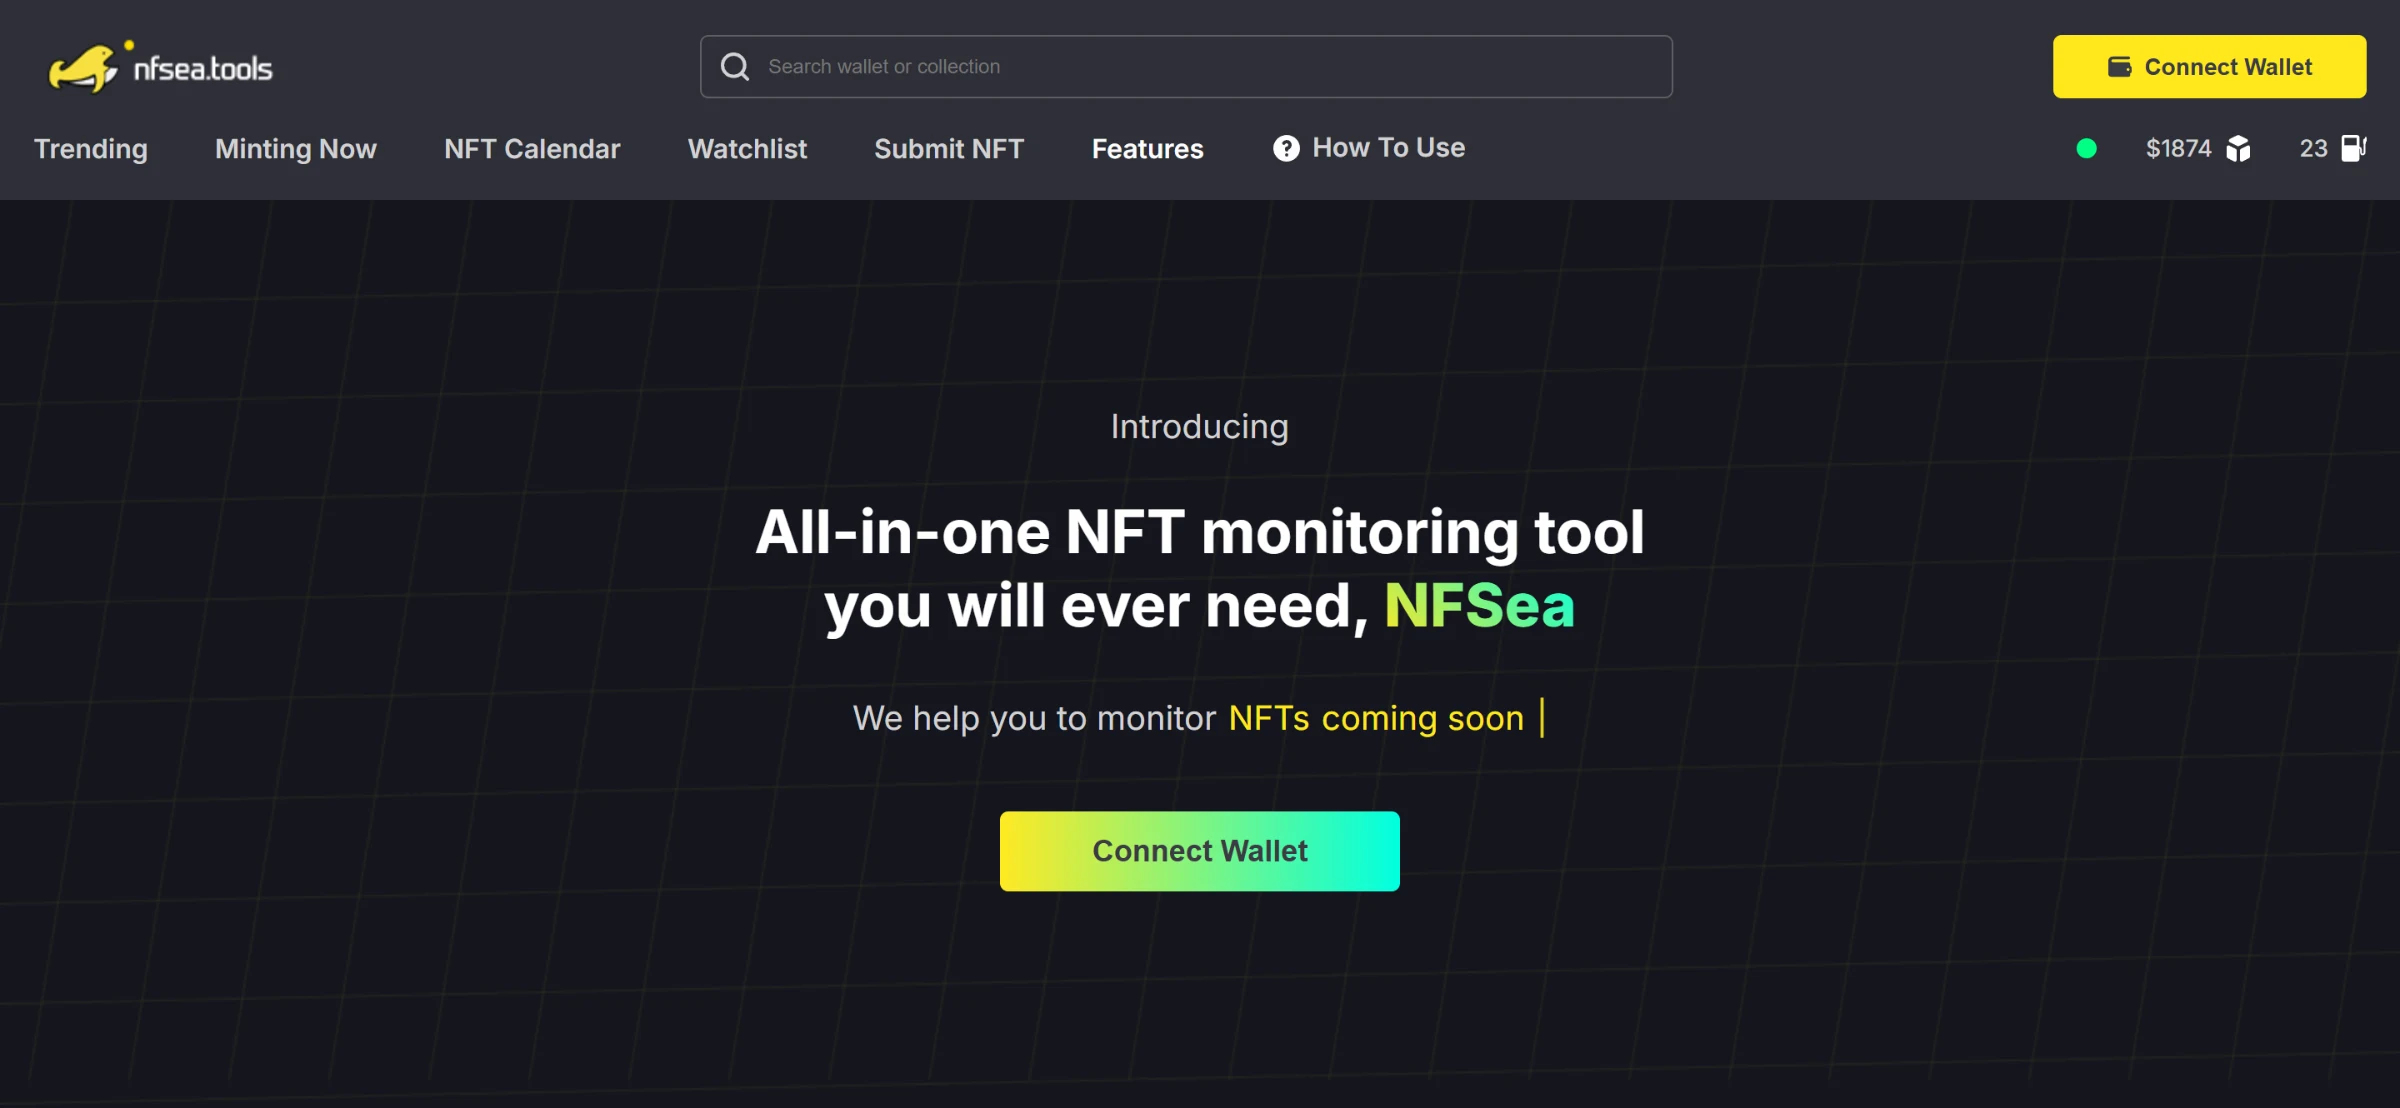
The features page.
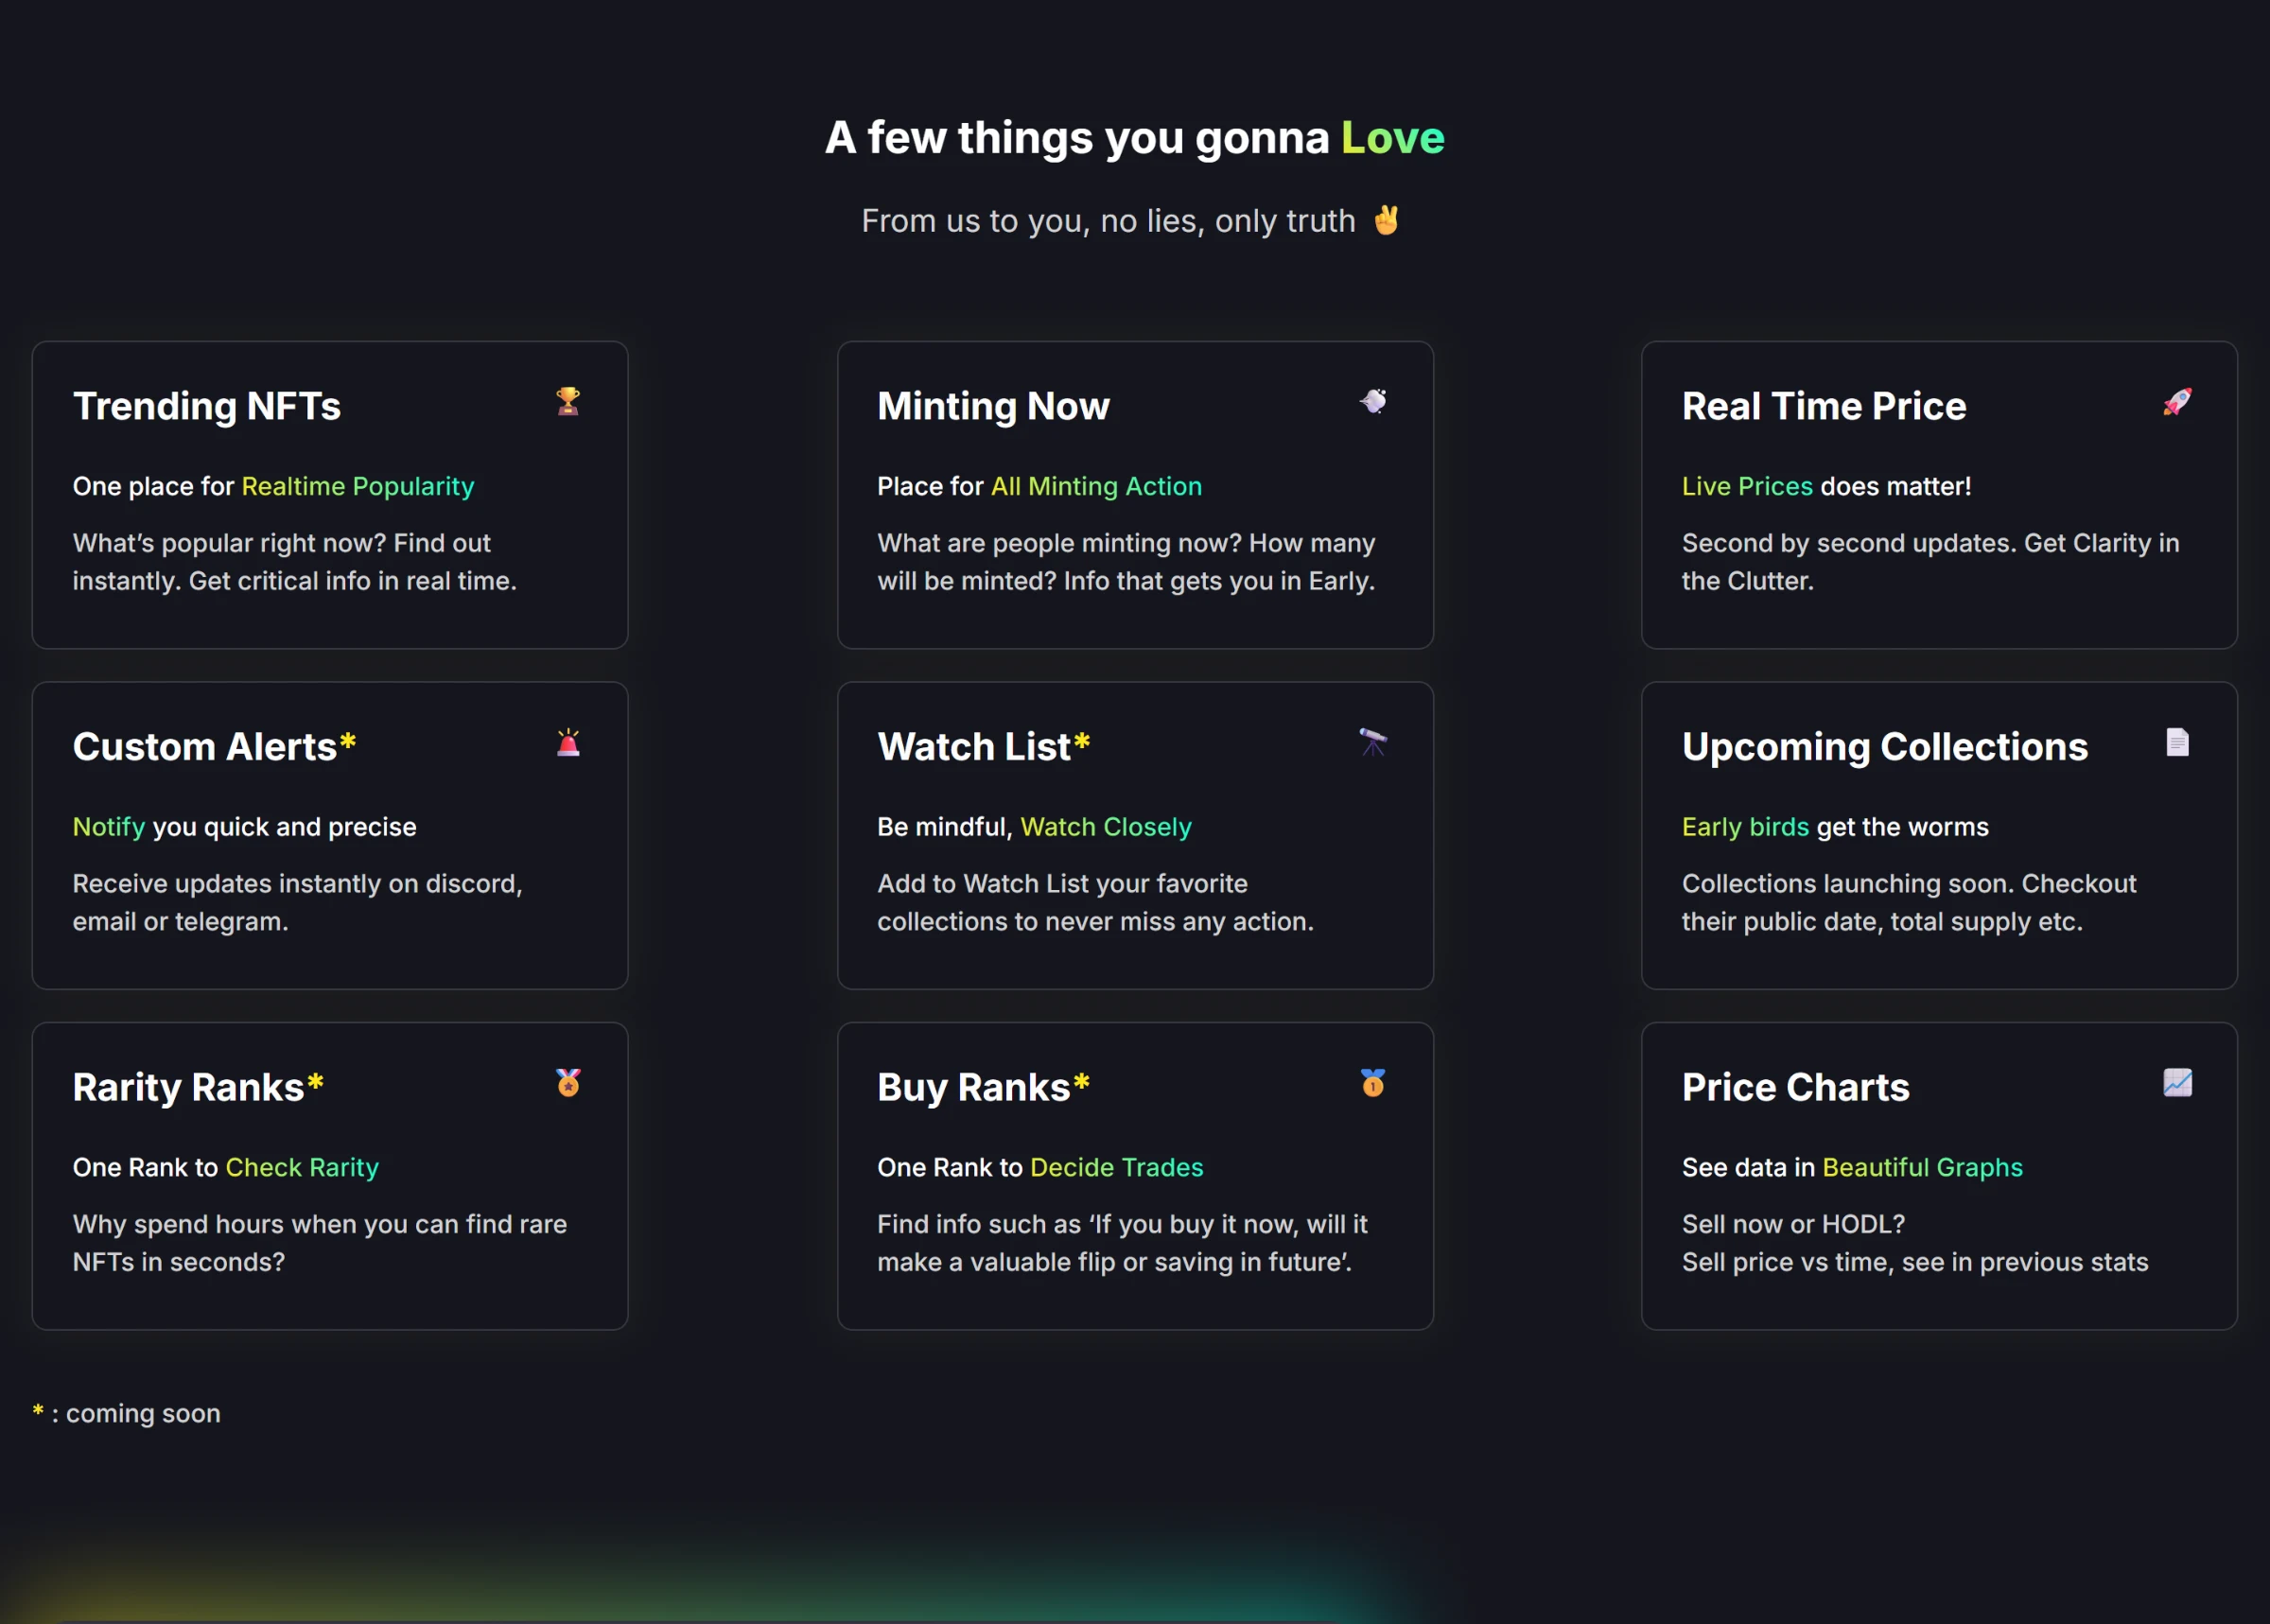
What the tool did, and what was still to come.
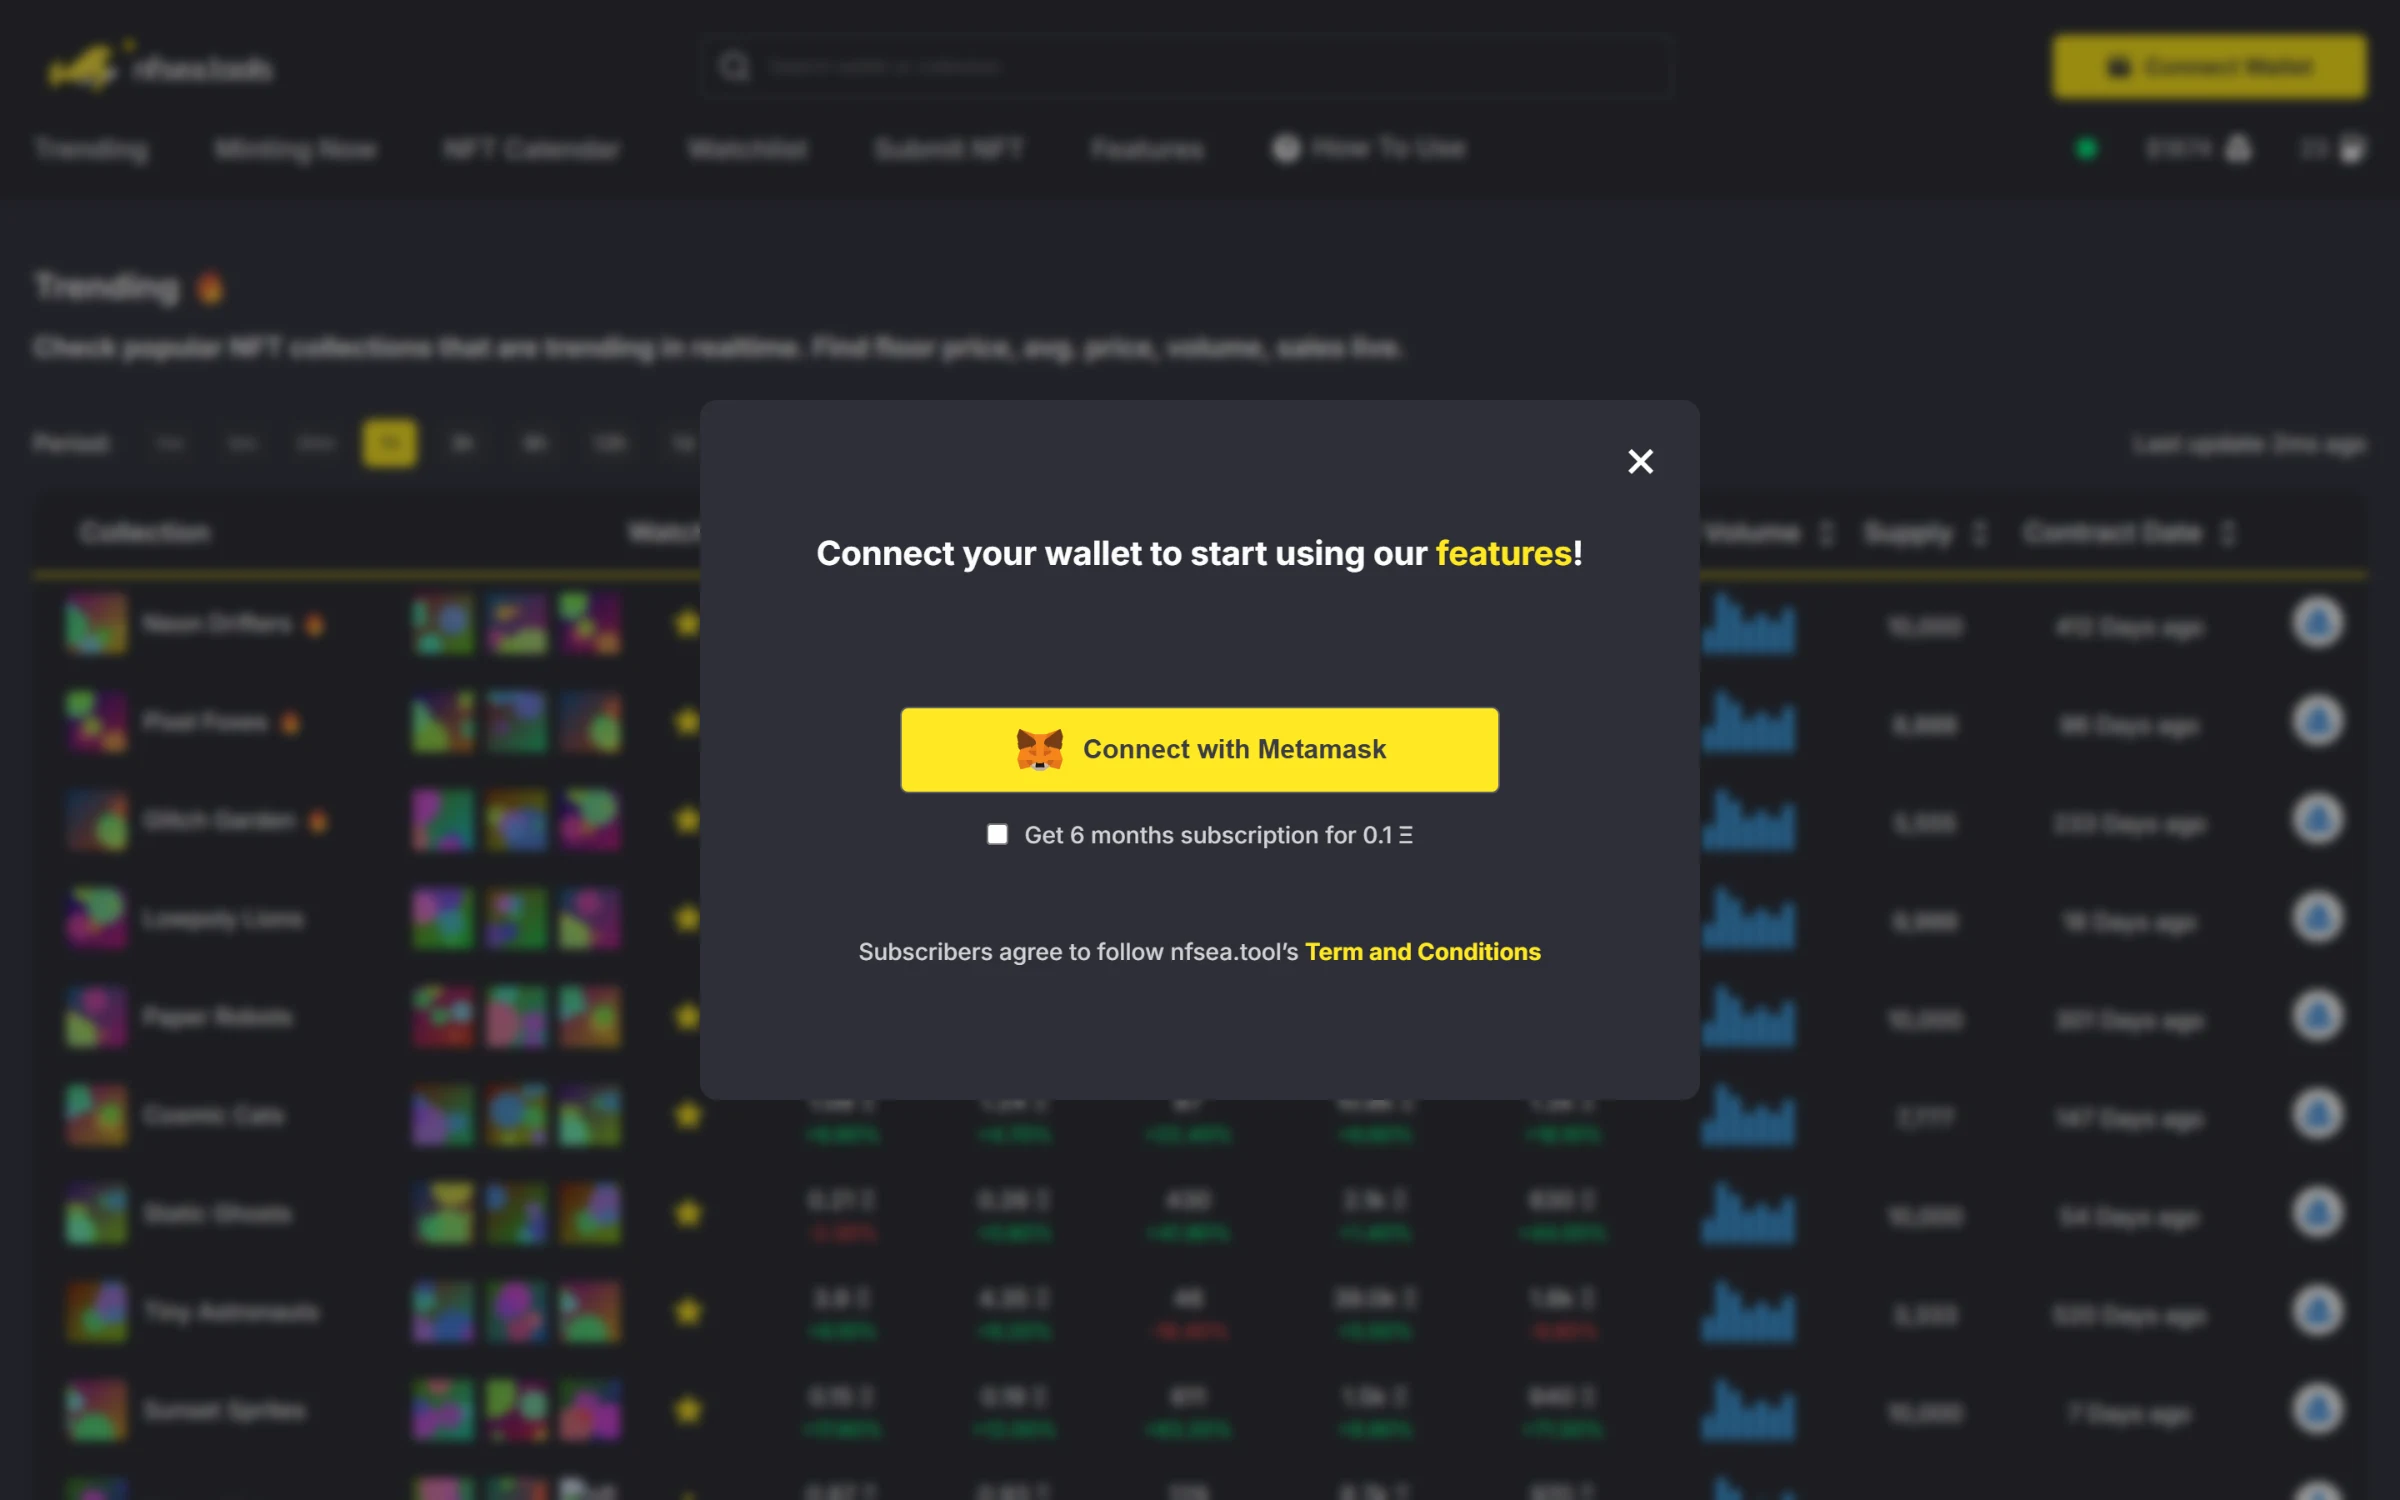
Signing in with a wallet.
On a phone
The tables scroll sideways inside their card while the collection name stays readable, and the header keeps the ETH price and gas in view.
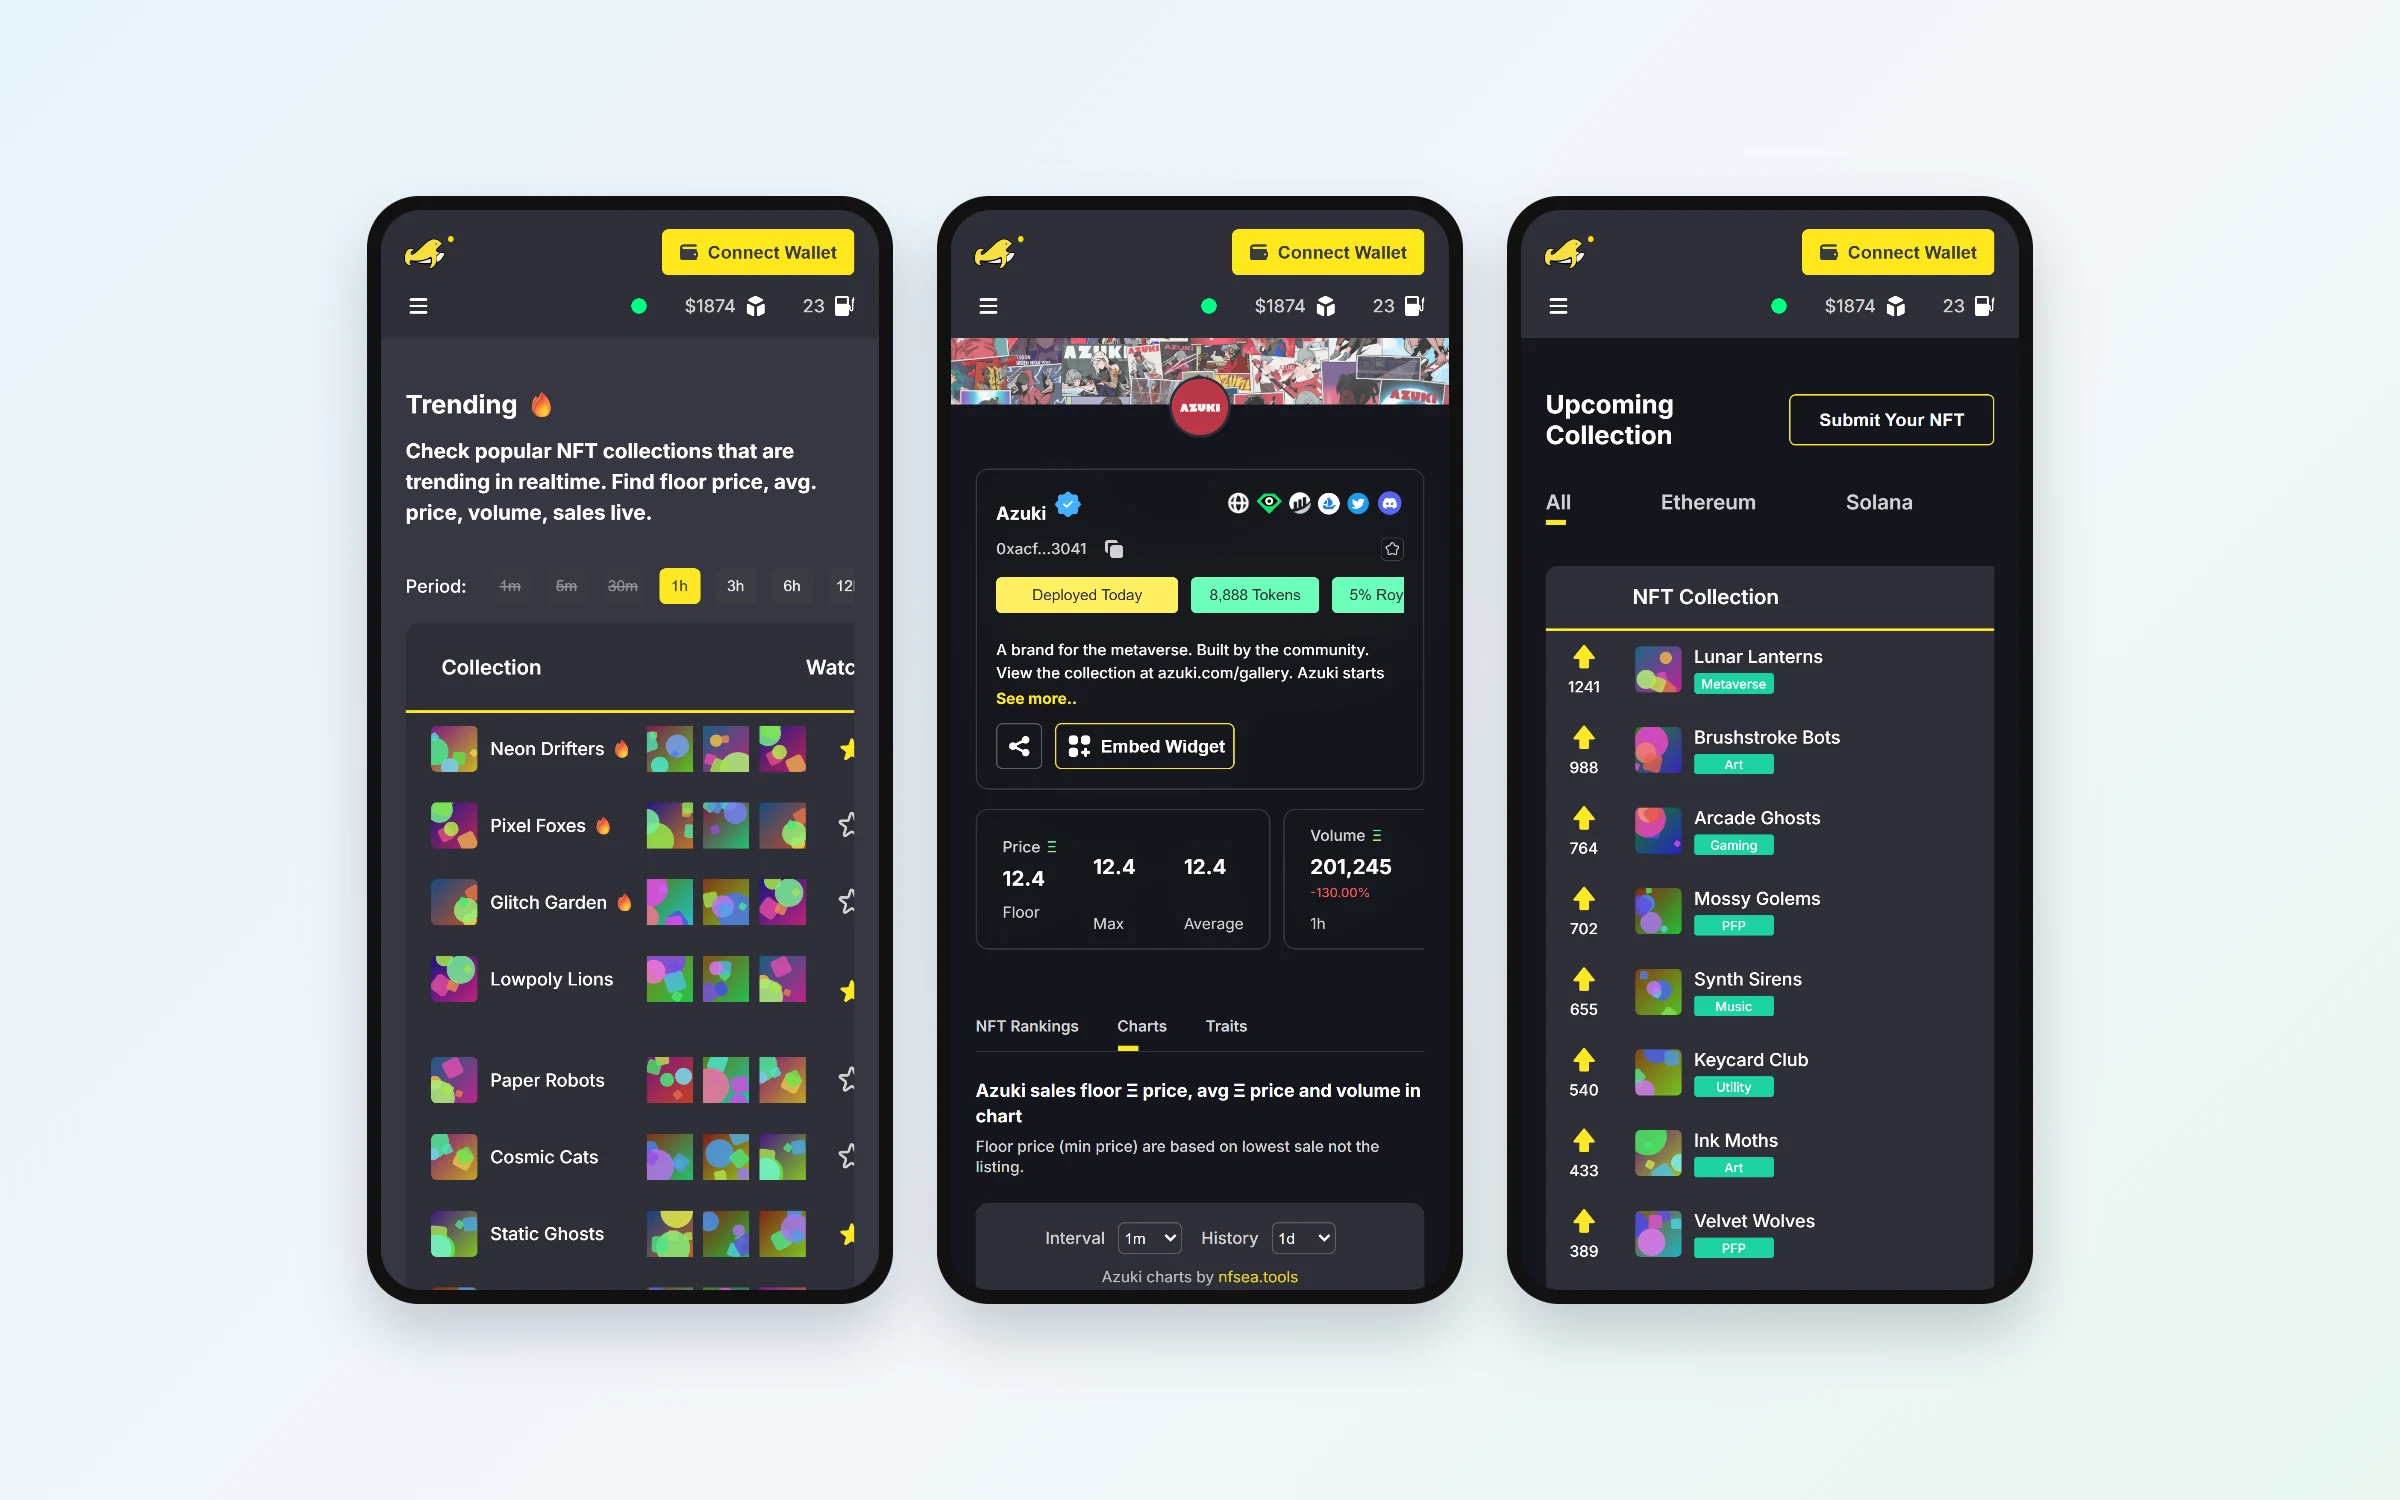
Trending, the Azuki page and the calendar on a phone.